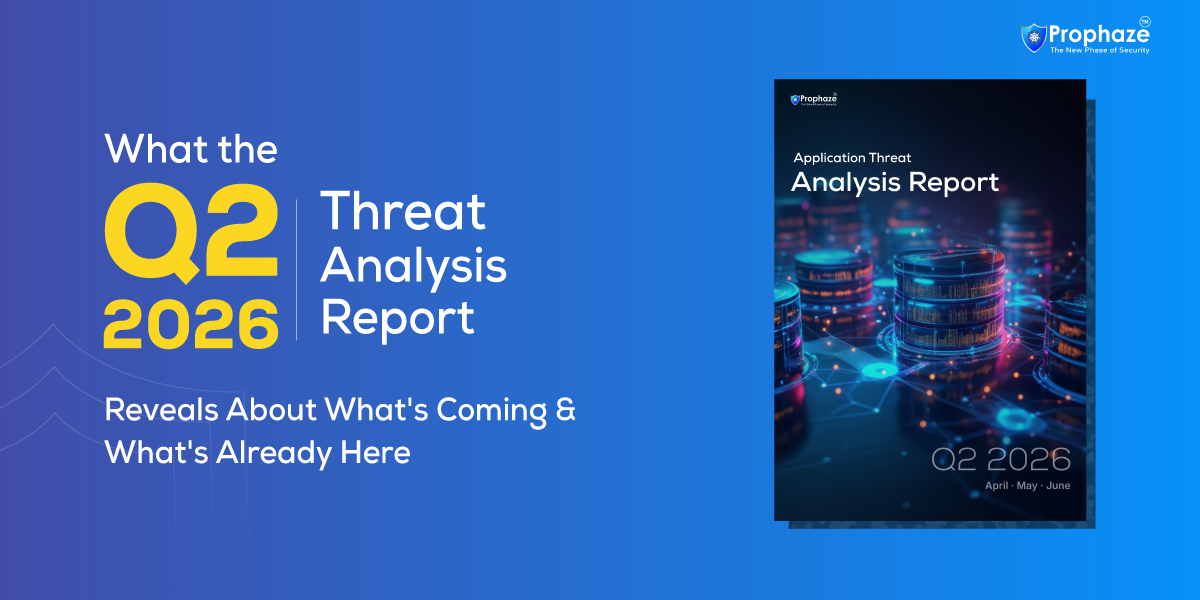
Between April and June 2026, Prophaze blocked 16.4 million attacks across 2.33 billion requests spanning 581 domains in 11 industries. Total attack volume fell 18% from Q1. That drop is real, but it measures the wrong thing. Seven of eleven industries saw attacks rise. Four crossed triple-digit growth. Healthcare recorded a 62-fold increase. And the root cause behind nearly half of everything blocked – unpatched components – grew its share for the second consecutive quarter. Some of this is emerging. Most of it is already here.
Methodology
This analysis covers 581 monitored domains across 11 industries, April 1 – June 30, 2026, drawn from Prophaze’s 24×7 WAAP telemetry and runtime API discovery across customer estates. All figures are blocked-attack events observed in production traffic, classified against OWASP Top 10 and OWASP API Security Top 10 categories. Growth figures compare Q2 2026 to Q1 2026 across the same monitored set.
What's already here
These aren’t predictions. They’re patterns the Q2 data has already confirmed – shifts that moved from signal to trend between April and June.
1. The 18% decline is a measurement artifact, not a real improvement
Traffic across the monitored estate grew 17% over the quarter while blocked attacks fell 18%. If the internet got busier and attacks got fewer, that should be straightforward good news. It isn’t.
The decline traces back to a single sector’s Q1 scanning campaign running its course. When high-volume, low-sophistication automated scanning stops, it pulls the aggregate down – and every trend line built on that aggregate inherits the distortion. The actual attack rate in Q2 settled around 7 malicious requests per 1,000, which is lower than Q1, but masks what happened inside the seven industries where pressure was rising.
2. Healthcare is now an active target, not a quiet bystander
Healthcare & Pharmaceuticals recorded 828,054 attacks in Q2, up from 13,234 in Q1. A 62-fold increase. A quarter ago, this was one of the quietest sectors on the list.
The mechanism matters more than the multiplier. This wasn’t one attack category spiking in isolation; multiple OWASP categories climbed together across all three months of the quarter. Isolated spikes typically indicate a single automated campaign finding an exposed target. Correlated, sustained growth across categories is the signature of deliberate targeting: adversaries probing broadly, finding what responds, then returning with sharper tools.
What it means now: Q1 baselines are no longer a usable reference point for alert thresholds, staffing models, or exposure assessments in this sector. Any dashboard still benchmarked against Q1 is showing a floor that no longer exists.
3. Finance has a recurring authentication problem and it's now plannable
Broken Authentication accounted for 92.4% of Finance & Banking attack traffic in June, nearly mirroring a spike the sector recorded back in March.
Two quarters. Same attack class. Same near-total concentration. Months apart.
A single spike is an incident. A repeated spike at the same magnitude is a pattern and patterns are the one thing defenders can get ahead of. For financial services teams, this points directly at authentication-layer controls – token validation, session management, credential-stuffing defenses – as the highest-leverage investment for Q3.
4. Unpatched components are now the dominant root cause
Outdated and unpatched components accounted for 48.2% of all attacks blocked in Q2 2026, up from 41.8% in Q1. Nearly half of everything blocked traced back to a vulnerable component that already had a fix available.
That share rising while total volume falls is the more revealing signal. Attackers didn’t diversify their approach; they concentrated on the reliable path. In several sectors, known-vulnerable components were close to the only entry point attempted. Not because adversaries got more sophisticated, but because they didn’t need to.
What it means now: Patching velocity is the single highest-leverage metric this data points to. Not threat intelligence. Not detection coverage. Closing known vulnerabilities before they’re scanned is where the ROI sits and this data says the window between “scan” and “exploit” is compressing, not widening.
What's coming
These are the forward-looking signals the Q2 data puts in motion shifts that aren’t fully formed yet but have enough momentum in the telemetry to plan against.
5. Four industries should expect Q3 to start where Q2 spiked, not where Q1 ended

When four sectors cross triple-digit growth simultaneously, the standard assumption – “it will revert to the mean” – needs evidence, not hope. None of these sectors showed a June decline steep enough to suggest the pressure was temporary.
What to plan for: Q3 risk assessments in these verticals should use Q2’s peak month, not Q2’s average, as the working baseline. If May’s spike represents the new normal, resourcing built on Q1 data is already short.
6. A common attack sequence is becoming a shared playbook
Energy, manufacturing, healthcare, software, government – sectors with almost nothing structurally in common – showed the same three stage progression in Q2:
- Broad reconnaissance - wide, low effort probing across exposed surface area.
- Signal collection - identifying which endpoints respond, which auth paths are weak, which components are outdated.
- Narrow exploitation - concentrated, higher effort attacks against the small set of targets that proved vulnerable.
Stage one is noisy and easy to dismiss as background scanning. It’s also the only stage where defenders get advance warning. The gap between stage one and stage three between “probed” and “exploited” is where the intervention window sits.
What to plan for: Organizations that treat reconnaissance stage alerts as leading indicators rather than routine noise gain weeks of preparation time. Organizations that filter them out meet the campaign at stage three, when options are fewer and the blast radius is already defined.
7. The mid-quarter spike pattern means monthly monitoring now matters more than quarterly
April was quiet. In May, not attack volume rose nearly fivefold in a single month. June eased but never returned to April’s baseline.

A quarter that quintuples mid-stream and settles above its own starting point is not a landscape cooling down. It’s one that found a new floor. And the only way to catch a mid-quarter shift like May’s is to be looking at monthly or weekly data, not waiting for the quarterly roll-up.
What the full threat analysis report covers
This blog is the shape. The full Q2 2026 Application Threat Analysis Report is where the sector-level detail lives:
- Sector-by-sector OWASP breakdowns across all 11 industries.
- Month-by-month attack movement inside each industry, not just quarter totals.
- Direct Q1-to-Q2 comparison with normalized attack rates.
- Q3 2026 outlook built on what measurably shifted, not on assumed continuation.
- Security recommendations drawn from this quarter's data patching priorities, bot mitigation, and API visibility.
If your industry appears in the growth table above, the sector detail tells you exactly what changed and where. If it doesn’t, the more useful question is whether your sector was quiet for a structural reason – or quiet before a spike.
Prefer to talk it through first? Schedule a demo or talk to a security expert
- Get the full Q2 2026 Application Threat Analysis Report
Benchmark your exposure against 581 monitored domains and get ahead of Q3 before it becomes Q3’s headline.
Frequently Asked Questions (FAQ)
1. Did cyberattacks decrease in Q2 2026?
Total blocked attack volume fell 18% quarter-over-quarter, but that decline reflects the end of one sector’s Q1 scanning campaign rather than reduced threat activity. Seven of eleven monitored industries saw attacks increase, four by more than 300%.
2. Which industry saw the largest increase in cyberattacks in Q2 2026?
Healthcare & Pharmaceuticals, with 828,054 blocked attacks in Q2 compared to 13,234 in Q1 – a 62-fold increase driven by multiple OWASP attack categories rising together rather than a single campaign.
3. What is the most common root cause of web application attacks in 2026?
Outdated and unpatched components, which accounted for 48.2% of all attacks blocked in Q2 2026, up from 41.8% in Q1.
4. What percentage of Finance & Banking attacks targeted authentication in Q2 2026?
Broken Authentication made up 92.4% of Finance & Banking attack traffic in June 2026, closely mirroring a comparable spike in March 2026 – forming a recurring quarterly pattern.
4. What should security teams expect in Q3 2026?
Four industries crossed triple-digit attack growth in Q2, and none showed a June decline steep enough to indicate reversion. The Q2 data suggests that Q3 baselines should be set from Q2’s peak month, not its average, especially in healthcare, manufacturing, legal services, and energy.
5. How is this threat analysis data collected?
From Prophaze’s 24×7 WAAP telemetry and runtime API discovery across 581 monitored domains in 11 industries, covering 2.33 billion requests between April 1 and June 30, 2026.